

As public health researchers, we track and analyze data on the health status of Americans. Our database on every death in the United States for the past 50 years (Mortality Information and Research Analytics) allows us to examine geographic patterns of mortality. Using this data system, we noticed state-by-state associations between mortality rates and the percent of support for the major party presidential candidates in the 2016 Presidential Election.
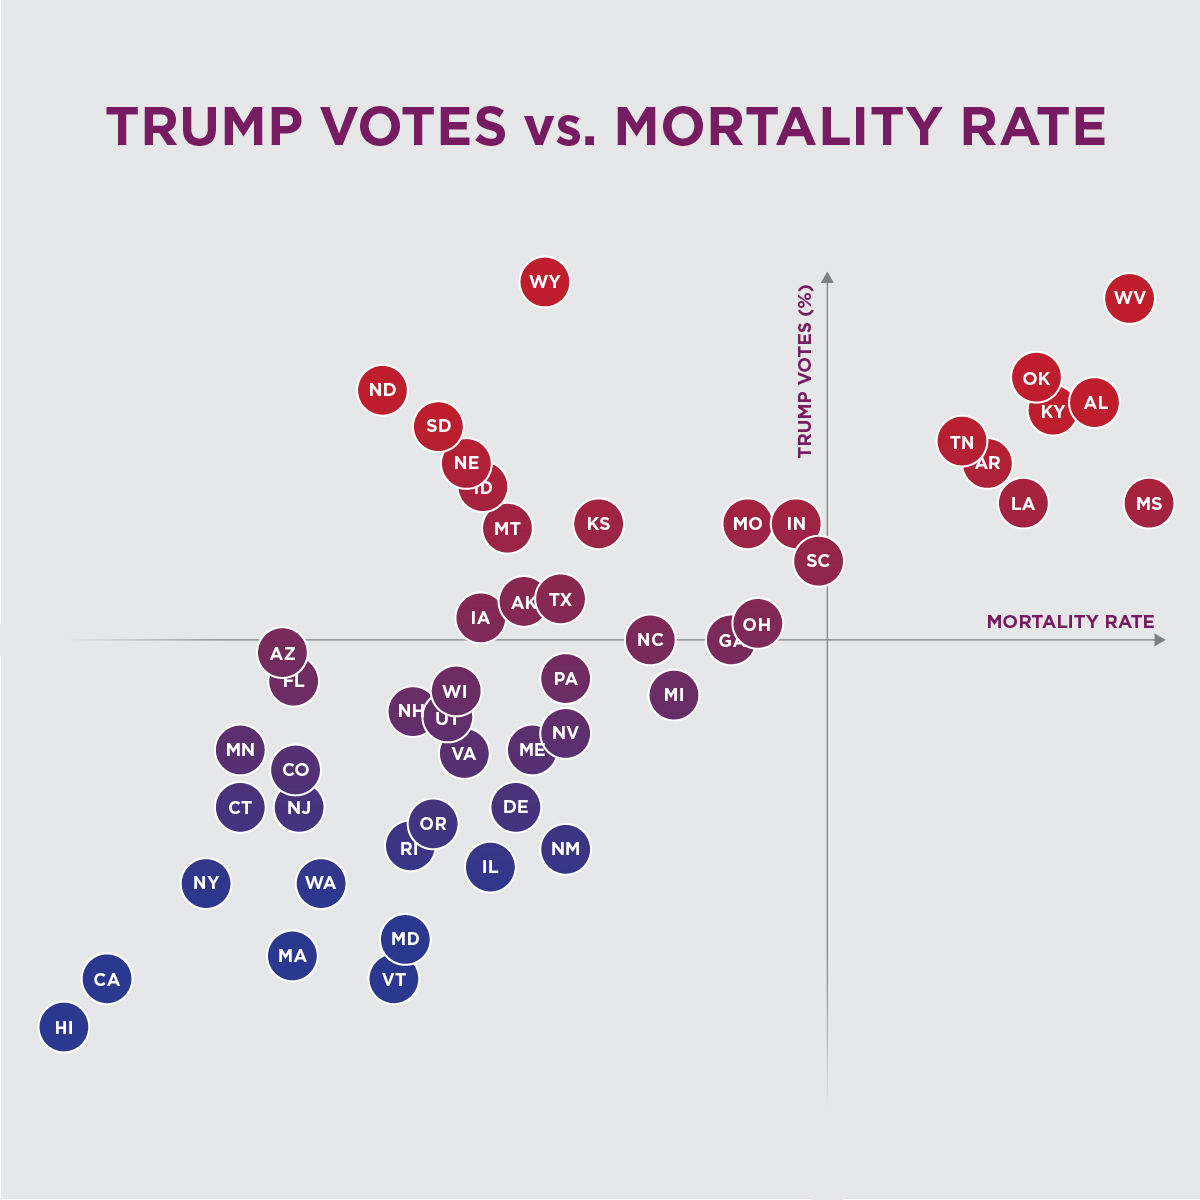
Analyzing data from all 50 states, we found a strong association between all-cause mortality rates (data from 2014, the most recent data available) and the percent of votes for President Donald Trump in the 2016 general election.
The 16 states with the highest mortality rates all voted for Trump in the election, while 15 of the 18 states with lowest mortality voted for Hillary Clinton. In a more detailed analysis, we found that the death rates among whites (both males and females) were better predictors of votes for Trump than death rates among other races/ethnicities. Although the association of mortality and voting preference is very strong, it’s not perfect. Interestingly, a cluster of seven north central states all showed a greater voting preference for Trump than might be expected, based on mortality rates alone.
Much has been written about why Trump won the election. This data suggests Trump voters were expressing dissatisfaction with real problems that included shorter lives and less healthy living conditions. We hope that the new administration will work to improve health and longevity for all Americans.
Buchanich is deputy director of the Center for Occupational Biostatistics and Epidemiology at the University of Pittsburgh Graduate School of Public Health, Woolley is a doctoral candidate at Pitt Public Health, and Burke is dean of Pitt Public Health.
Related Posts:


![]()
![]()
![]()
![]()
![]()
![]()
![]()